Website Performance Checker Tool Online
Last updated:
Check any website's performance, TTFB, page size, compression, caching, render-blocking resources, lazy loading, third-party domains, and more. Instant results with actionable fixes.
Enter a URL to check performance:
Slow site? This one loads instantly — yours can too.
The site you are on right now is built for speed (feel free to click around). We do the same for client sites: Core Web Vitals, caching, code cleanup.
Decent speed. Want “instant”?
This site loads like an app — no reloads, no waiting. We build and optimize sites to feel exactly like this.
How the Performance Checker Works
This tool measures server-side and HTML-level performance without needing a browser engine:
- Enter a URL, the tool fetches the page and measures the server response time (TTFB) and download time.
- Response analysis, checks HTTP headers for compression (Gzip/Brotli), caching (Cache-Control), HTTPS, and server identification.
- HTML audit, scans the markup for external scripts, stylesheets, images, inline assets, render-blocking resources, lazy loading, modern image formats, and preconnect/preload hints.
- Third-party detection, counts unique third-party domains that require additional DNS lookups and connections.
- Score + recommendations, you get a performance score, timing metrics, resource breakdown, and specific actionable fixes.
Why Website Performance Matters
Speed directly impacts your business:
- SEO rankings, Google uses Core Web Vitals as ranking signals. Slow pages lose positions to faster competitors.
- Conversion rates, a 1-second delay in page load can reduce conversions by 7%. Amazon found every 100ms of latency cost 1% in revenue.
- Bounce rate, 53% of mobile users abandon sites that take longer than 3 seconds to load (Google data).
- User experience, fast sites feel more professional and trustworthy. Slow sites frustrate users before they even read your content.
- AI search, AI engines need to crawl and process your pages efficiently. Fast-loading, well-structured pages are more likely to be cited in AI search results.
For complete optimization, also check your images, security headers, and meta tags. Use the Font Checker to see if Google Fonts or excessive font weights are adding unnecessary load time. For mobile performance specifically, run the Mobile-Friendly Checker to catch viewport and render-blocking issues. Then measure your lab Core Web Vitals and break down asset sizes with the Page Weight Checker.
Quick Wins for Faster Websites
These fixes deliver the biggest performance gains with the least effort. If you'd rather not tackle them yourself, our website speed and performance optimization service handles all of them for you:
- Enable compression, Gzip or Brotli reduces HTML/CSS/JS transfer size by 60-80%. Most hosting providers support this.
- Add defer to scripts, change
<script src="...">to<script src="..." defer>to eliminate render blocking. - Use a CDN, serve your site from edge servers near your users. Reduces TTFB dramatically for global audiences.
- Lazy load images, add
loading="lazy"to below-fold images. Reduces initial page weight significantly. - Use WebP/AVIF, modern image formats are 25-50% smaller than JPEG/PNG with same quality.
- Set Cache-Control, cache static assets for at least 1 year. Repeat visitors load instantly from browser cache.
Core Web Vitals Thresholds
Google scores each metric as Good, Needs improvement, or Poor. Aim for "Good" on all three:
| Metric | Good | Needs work | Poor |
|---|---|---|---|
| LCP Largest Contentful Paint | ≤ 2.5s | 2.5s – 4.0s | > 4.0s |
| INP Interaction to Next Paint | ≤ 200ms | 200ms – 500ms | > 500ms |
| CLS Cumulative Layout Shift | ≤ 0.1 | 0.1 – 0.25 | > 0.25 |
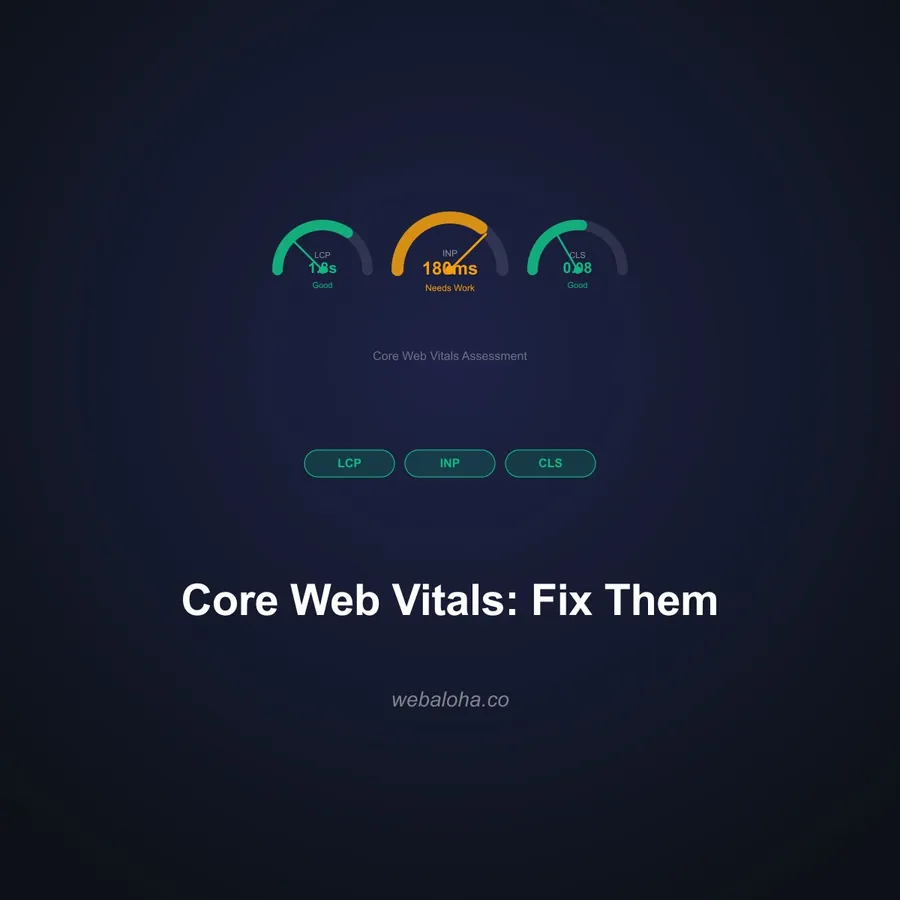
INP replaced First Input Delay (FID) as a Core Web Vital in March 2024. Thresholds apply to the 75th percentile of real-user page loads.
For professional optimization, explore our SEO services and web design services. To understand the metrics behind your score, read our guide to Core Web Vitals and how to fix them.
Next steps
Performance Checker related tools and articles
Continue with the closest follow-up checks and guides based on this tool's topic, crawl intent, and optimization workflow.


Performance Checker: FAQ
What does this performance checker measure?
What is TTFB and why does it matter?
What are render-blocking resources?
How does this differ from Google PageSpeed Insights?
What is a good page size?
Why does compression matter?
What are preconnect and preload hints?
How many third-party domains is too many?
What is a good performance score?
Why is my page slow even though the score is high?
Is this performance checker free?
Does this tool store the URLs I check?
Free 48-Hour Website Audit
Not sure what to fix first on your own website? We'll review it and tell you, in plain English. Free & non-obligatory.
Need Help Speeding Up Your Website?
We help businesses build fast, optimized websites that rank and convert.