Every second your page takes to load, every time content jumps unexpectedly, every laggy button click, these are not just annoyances. They are ranking signals.
Google formalized this in 2021 with Core Web Vitals, a set of real-world metrics that measure how users actually experience your site. Since then, the bar has gotten higher. In March 2024, Google replaced the old First Input Delay (FID) metric with Interaction to Next Paint (INP), making the responsiveness test significantly harder to pass.
If you care about SEO for your business, you need to understand and pass these three metrics. This guide covers exactly what they measure, why Google cares, and the specific fixes that move the needle.
What Are Core Web Vitals?
Core Web Vitals are three specific page experience metrics that Google uses as ranking signals. They are part of a broader set of Page Experience signals that includes mobile-friendliness, safe browsing, HTTPS, and no intrusive interstitials.
What makes CWV different from most SEO factors is that they are measured using real user data, collected by Chrome browsers and aggregated in the Chrome User Experience Report (CrUX). You are not being judged on how fast your page loads on a perfect fiber connection in a server farm. You are being judged on how it loads for your actual visitors, on their actual devices and connections.
The three metrics are:
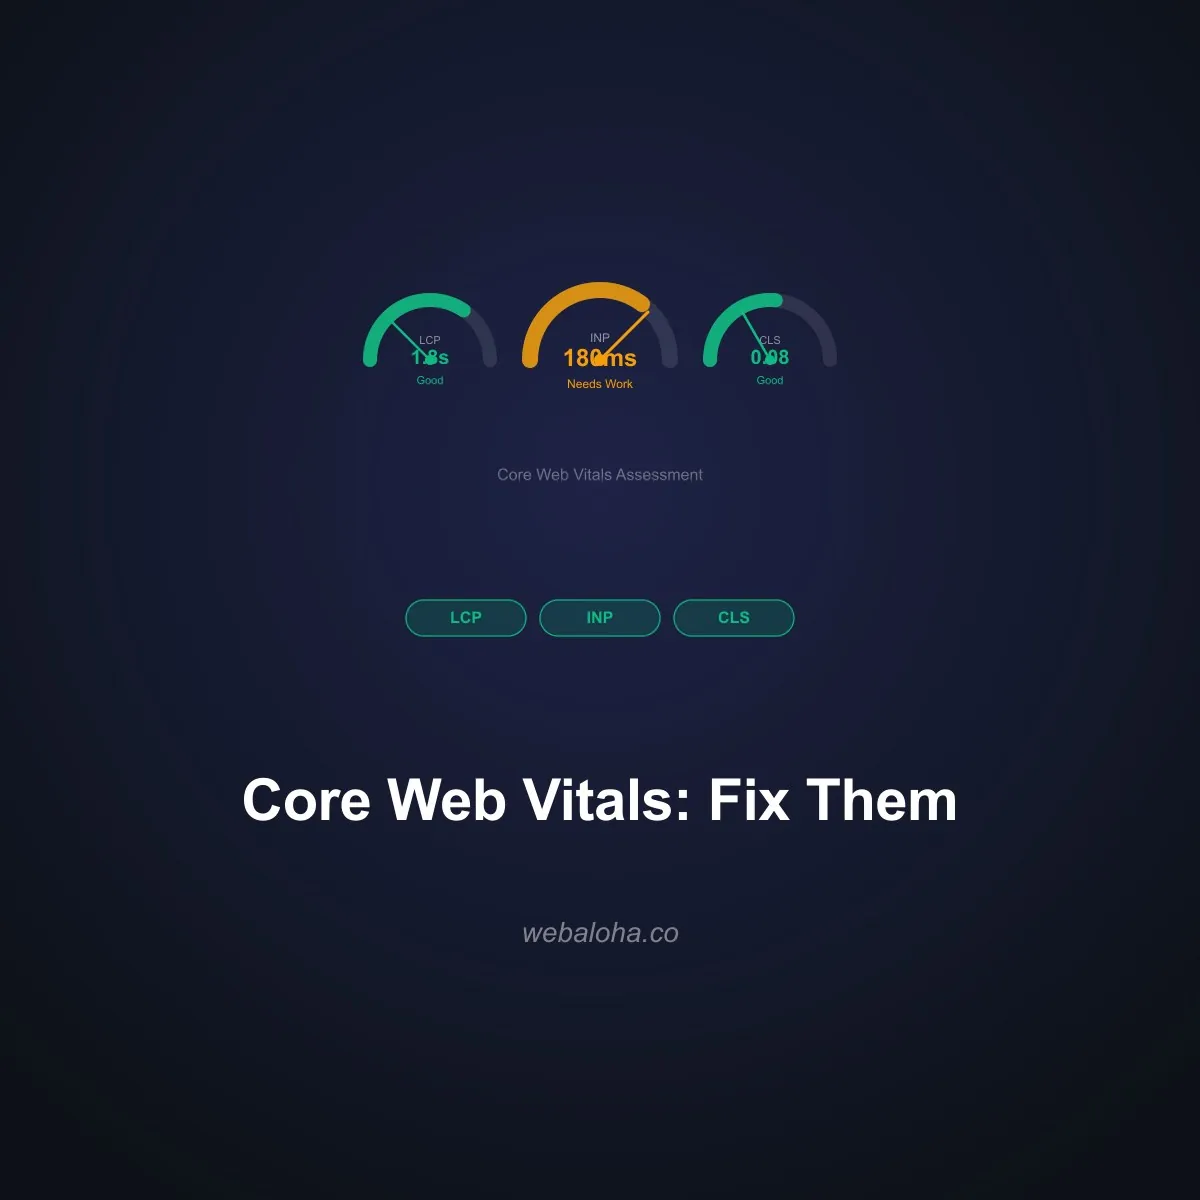
- LCP (Largest Contentful Paint): How fast does the main content load?
- INP (Interaction to Next Paint): How fast does the page respond to user input?
- CLS (Cumulative Layout Shift): Does content jump around unexpectedly?
The Traffic Light Scoring System
Google grades each metric on a three-tier system. Your page needs to hit “Good” for 75% of real-user visits to pass the assessment for that metric.
| Metric | What It Measures | Good | Needs Work | Poor |
|---|---|---|---|---|
| LCP | Loading performance | ≤ 2.5s | 2.5s to 4.0s | > 4.0s |
| INP | Responsiveness | ≤ 200ms | 200 to 500ms | > 500ms |
| CLS | Visual stability | ≤ 0.1 | 0.1 to 0.25 | > 0.25 |
The 75th percentile rule is important. A single slow page load does not fail you. But if 25% or more of your real users experience poor performance, Google considers the page failing.
Why Google Uses Core Web Vitals as a Ranking Signal
Google’s business depends on users trusting search results to deliver good experiences. If Google sends users to slow, unstable pages, users lose faith in Google itself.
The data behind the decision is compelling. Google’s research found that pages meeting the Good threshold for all CWV have a 24% lower abandonment rate than pages in the Poor range. A 0.1 improvement in CLS score can cut abandonment by 24%. Even a 0.1-second improvement in LCP can lift conversion rates by roughly 15%.
For competitive search categories, CWV acts as a tiebreaker. Two pages with similar content quality and backlink profiles will be differentiated by page experience. The faster, more stable page wins. That is why pairing solid on-page SEO with strong technical performance matters more than ever.
The numbers from the web at large are sobering: roughly 42% of the top 1,000 websites fail at least one Core Web Vital. Among e-commerce sites, 60% fail CWV assessments. And mobile performance is dramatically worse than desktop: 75% of mobile sites fail at least one metric, compared to 45% of desktop sites. Since Google uses mobile-first indexing, the mobile score is the one that counts.
LCP: Largest Contentful Paint
What LCP Measures
LCP measures how long it takes for the largest visible content element to render on screen. This is almost always your hero image, a large headline, or a video thumbnail. Think of it as the moment when the user can see that the page has actually loaded something meaningful.
The target: LCP in 2.5 seconds or less.
Why LCP Fails
LCP problems almost always trace back to one of four root causes:
- Slow server response (TTFB): If the server takes more than 600ms to respond, LCP will almost certainly miss the 2.5s target before a single byte of content has loaded.
- Unoptimized hero images: Large, uncompressed images in legacy formats (JPEG, PNG) are the single most common LCP killer.
- Render-blocking resources: CSS and JavaScript files that load synchronously in the
<head>block the browser from painting anything until they finish. - Late-loading fonts: A hero section with custom fonts that loads text invisibly until fonts arrive delays the LCP element.
LCP Fixes
Optimize your LCP image first. Convert hero images to WebP or AVIF format. AVIF offers 50% smaller files than JPEG at equivalent quality. Use srcset for responsive sizing so mobile devices download appropriately sized images.
<!-- Correct: preloaded, modern format, explicit dimensions -->
<link rel="preload" as="image" href="/hero.avif" fetchpriority="high" />
<img
  src="/hero.avif"
  width="1200"
  height="630"
  alt="Hero image description"
  fetchpriority="high"
/>
Never lazy-load your LCP image. This is a common mistake. The loading="lazy" attribute tells the browser to defer loading, which destroys LCP. Reserve lazy loading for images below the fold.
Preload your LCP image. Add a <link rel="preload"> tag with fetchpriority="high" in your <head>. This tells the browser to fetch the image immediately, before it even starts parsing the page body.
Improve server response time. Target a Time to First Byte (TTFB) under 600ms. The most effective levers: use a CDN to serve assets from servers near your users, enable HTTP/2 or HTTP/3, and implement aggressive server-side caching. Confirm which protocol your server negotiates with our HTTP/2 & HTTP/3 Checker.
Eliminate render-blocking resources. Add defer or async to non-critical scripts. Inline critical above-the-fold CSS directly in the <head>, and load the full stylesheet asynchronously. Strip dead weight from those files first with our CSS Minifier and JavaScript Minifier, and compress your markup with the HTML Minifier.
<!-- Defer non-critical scripts -->
<script src="/analytics.js" defer></script>

<!-- Load non-critical CSS asynchronously -->
<link rel="preload" href="/styles.css" as="style" onload="this.rel='stylesheet'" />
This work is also foundational to a solid technical SEO audit. If your LCP is failing, the same issues are almost certainly hurting your crawl budget and TTFB signals.
INP: Interaction to Next Paint
What INP Measures
INP replaced First Input Delay (FID) as an official Core Web Vital in March 2024. Where FID only measured the delay before the browser started processing your first interaction, INP measures every interaction throughout the page session: clicks, taps, and keyboard inputs. It reports the worst-case interaction latency above the 98th percentile.
The target: INP under 200ms.
If a user clicks a button and nothing visually changes for 400ms, that is a failing INP. It does not matter if the actual result is fast, the perceived responsiveness is what matters.
Why INP Fails
INP problems are almost always caused by JavaScript overloading the browser’s main thread:
- Long tasks (JavaScript execution lasting more than 50ms) block the browser from processing input
- Heavy third-party scripts running at interaction time
- Synchronous DOM operations triggered by event handlers
- Excessive re-renders in JavaScript frameworks
INP Fixes
Break up long tasks. Any JavaScript task longer than 50ms can block input processing. Use scheduler.yield() (or setTimeout(() => {}, 0) as a fallback) to break long work into smaller chunks and yield control back to the browser between them.
// Break a large loop into yielding chunks
async function processItems(items) {
  for (let i = 0; i < items.length; i++) {
    processItem(items[i]);
    // Yield every 50 items to keep the main thread responsive
    if (i % 50 === 0) {
      await scheduler.yield();
    }
  }
}
Audit third-party scripts. Ad networks, chat widgets, and tag manager payloads are notorious INP killers. Use Chrome DevTools Performance panel to identify which scripts are consuming main-thread time at interaction. Remove or delay anything not directly contributing to conversions.
Use passive event listeners. For scroll and touch events, add { passive: true } to prevent the browser from waiting to see if you will call preventDefault().
document.addEventListener('touchstart', handler, { passive: true });Defer non-critical JavaScript. Load analytics, chat, and social embeds after the page becomes interactive. A script loaded after the user’s first interaction cannot hurt INP for that interaction.
Poor INP is often a symptom of broader JavaScript architecture issues. This connects directly to website performance decisions made at the build stage, which is why choosing a performance-first framework pays dividends long after launch.
CLS: Cumulative Layout Shift
What CLS Measures
CLS measures the total amount of unexpected visual shifting that occurs during a page’s lifetime. Every time content jumps around without user input, that shift is scored and accumulated. A score of 0 means the page is perfectly stable. A score above 0.1 means users are experiencing noticeable, disruptive layout shifts.
The target: CLS under 0.1.
Why CLS Fails
Layout shifts happen when elements load or resize after initial render and push other content around. The most common culprits:
- Images and videos without
widthandheightattributes - Ads, embeds, or iframes with no reserved space
- Dynamically injected banners (cookie notices, promo bars) inserted above existing content
- Web fonts that swap in and cause text reflow
CLS Fixes
Always set explicit dimensions on media. This is the single highest-impact CLS fix. When the browser knows an image’s dimensions before it loads, it reserves the exact space in the layout. No reserved space means the page reflows when the image arrives.
<!-- Causes CLS: browser doesn't know the size -->
<img src="/photo.jpg" alt="Team photo" />

<!-- No CLS: browser reserves 800x450 immediately -->
<img src="/photo.jpg" width="800" height="450" alt="Team photo" loading="lazy" />
In CSS, the aspect-ratio property achieves the same result for responsive images:
img {
  width: 100%;
  height: auto;
  aspect-ratio: 16 / 9;
}
Reserve space for ads and embeds. If you run display advertising, use CSS min-height on ad containers to hold space before the ad loads. An empty container is invisible, a shifting container after the ad loads is a CLS event.
.ad-slot {
  min-height: 250px; /* Reserve space for a standard display ad */
  display: flex;
  align-items: center;
  justify-content: center;
}
Handle font loading carefully. Use font-display: optional for non-critical decorative fonts (no swap, no shift), or font-display: swap with a closely-matched fallback font. Tools like font-style-matcher help you align fallback metrics to reduce the visual jump when the webfont loads. Better still, self-host your fonts instead of calling Google Fonts at runtime; our Google Font Self-Hosting Helper generates the CSS and downloads for you.
Load dynamic content below the fold. If you must inject content dynamically (notification bars, personalization), inject it below existing content rather than above it. Or pre-allocate the space with CSS before the content loads.
How to Measure Core Web Vitals
Understanding your current scores before fixing anything is essential. Different tools tell you different things.
| Tool | Data Type | Best For | Free? |
|---|---|---|---|
| PageSpeed Insights | Lab + Field (CrUX) | Quick per-URL audit with real data | Yes |
| Google Search Console | Field (CrUX) | Site-wide pass/fail grouped by URL type | Yes |
| Lighthouse (DevTools) | Lab only | Diagnosing specific issues locally | Yes |
| WebPageTest | Lab (filmstrip, waterfall) | Deep waterfall analysis, multi-step tests | Yes |
| CrUX Dashboard | Field (historical) | Tracking score trends over time | Yes |
| web-vitals JS library | Field (custom RUM) | Capturing real-user data in your analytics | Yes |
Start with Search Console. The Core Web Vitals report in Google Search Console groups your URLs by status (Good, Needs Improvement, Poor) and clusters similar pages together. This tells you where the biggest problems are without having to test every page individually.
Use PageSpeed Insights to drill down. Once you know which page types are failing, run them through our PageSpeed Insights Checker for a detailed breakdown of specific issues. The “Field Data” section shows your real CrUX scores. The “Diagnostics” section shows what to fix.
Use Lighthouse for debugging. Lab data is not what Google ranks you on, but it is infinitely easier to debug. Run Lighthouse in an incognito window (to avoid extensions skewing results) to isolate specific issues.
Check your site on mobile too. Use our Mobile-Friendly Test to confirm that your responsive design is not introducing CLS or LCP issues specific to smaller viewports.
Our free Website Performance Checker gives you a combined score across all three Core Web Vitals metrics in one pass, which is useful before you start diving into individual diagnostic tools. To isolate the most common culprits, pair it with our Core Web Vitals Checker for field data, a Page Weight Checker to find oversized pages, and a GZIP / Brotli compression test to confirm your server is compressing text assets.
Fix Priority Matrix
Not all fixes are created equal. This matrix helps you prioritize by expected impact versus implementation effort.
| Fix | Metric | Impact | Effort | Do First? |
|---|---|---|---|---|
| Add width/height to images | CLS | High | Low | Yes |
| Preload LCP image | LCP | High | Low | Yes |
| Convert images to WebP/AVIF | LCP | High | Medium | Yes |
| Defer non-critical JS | LCP / INP | High | Medium | Yes |
| Remove or delay third-party scripts | INP / LCP | High | Medium | Yes |
| Enable CDN + caching | LCP (TTFB) | High | Medium | Yes |
| Break up long JavaScript tasks | INP | Medium | High | After quick wins |
| Rebuild on performance-first framework | All | Very High | Very High | Strategic |
Mobile vs Desktop: Why Mobile Scores Matter More
Google switched to mobile-first indexing in 2020. This means Google primarily uses your mobile page’s content and performance when determining rankings, even for desktop searches.
The practical implication: if your CWV scores are great on desktop but failing on mobile, your rankings are based on the failing mobile scores.
Mobile devices face compounding challenges: slower CPUs mean longer JavaScript execution times (hurting INP), slower network connections inflate LCP, and smaller screens make even small layout shifts feel jarring (hurting CLS perception).
Test every fix on mobile. Run your pages through PageSpeed Insights with the Mobile option selected. The scores will almost always be worse than desktop, and the recommendations may differ.
Core Web Vitals and Broader Technical SEO
Core Web Vitals do not exist in isolation. They are one part of a larger technical SEO audit picture. A slow page often has other technical issues: oversized HTML, missing resource hints, unoptimized third-party scripts that also interfere with crawling and indexing.
The good news is that fixing CWV tends to improve other technical signals simultaneously. Faster TTFB helps Googlebot crawl more pages per budget. Cleaner JavaScript improves rendering. Better image optimization reduces bandwidth costs for real users.
Canonical tag errors and redirect issues often surface in the same audit. See our canonical tags guide to make sure duplicate content problems are not counteracting your speed improvements.
CWV improvements also compound with other SEO work. Strong E-E-A-T signals, quality content, and solid internal linking build authority. CWV keeps that authority from being undermined by a poor page experience. Each of these factors reinforces the others.
If you have done a competitor analysis and your competitors are outranking you despite similar content, CWV is one of the first technical levers to check. Use our PageSpeed Insights Checker on their top-ranking pages to see their scores versus yours.
Structured data also interacts with page experience. Our Schema Markup Generator helps you add proper schema to high-priority pages, which, combined with good CWV scores, can qualify those pages for rich results in Google Search.
CWV and AI Search
AI search platforms like Google AI Overviews and ChatGPT Search pull content from pages to generate answers. Slow, unstable pages are less likely to be fully rendered and indexed, which means they have less surface area for AI systems to cite.
This connection between page experience and AI search visibility is becoming more important as AI search evolves. A site that passes CWV is more likely to be completely indexed, more likely to appear in rich results, and more likely to be cited in AI-generated answers than a site that fails.
Check your visibility in AI search with our AI Search Visibility Checker to see how your site currently performs across AI platforms.
What Happens After You Fix CWV
One important expectation to set: field data does not update immediately. After deploying fixes, Chrome needs to collect new real-user data over a 28-day rolling window. Search Console’s Core Web Vitals report reflects this delay.
Use PageSpeed Insights field data (the CrUX section at the top) to track progress. Once your field data shows improvement, expect Search Console to reflect the change within 4-6 weeks. Rankings typically respond within a few weeks of the field data improving, though the exact timeline depends on how frequently Google crawls your pages.
If you are in Hawaii or a regional market, local SEO services paired with CWV improvements can create a compounding advantage: local relevance signals combined with a fast, stable page experience is a difficult combination for competitors to beat.
For a comprehensive view of everything affecting your organic visibility, pair this work with a full technical SEO audit and a review of your sitemap configuration to ensure Google is finding and prioritizing your best pages.
Need help identifying what is holding your scores back? The team at Web Aloha has optimized CWV for businesses across Hawaii and beyond. Reach out to discuss your site’s specific situation.